
Reviewed November 22, 2026.
The short version
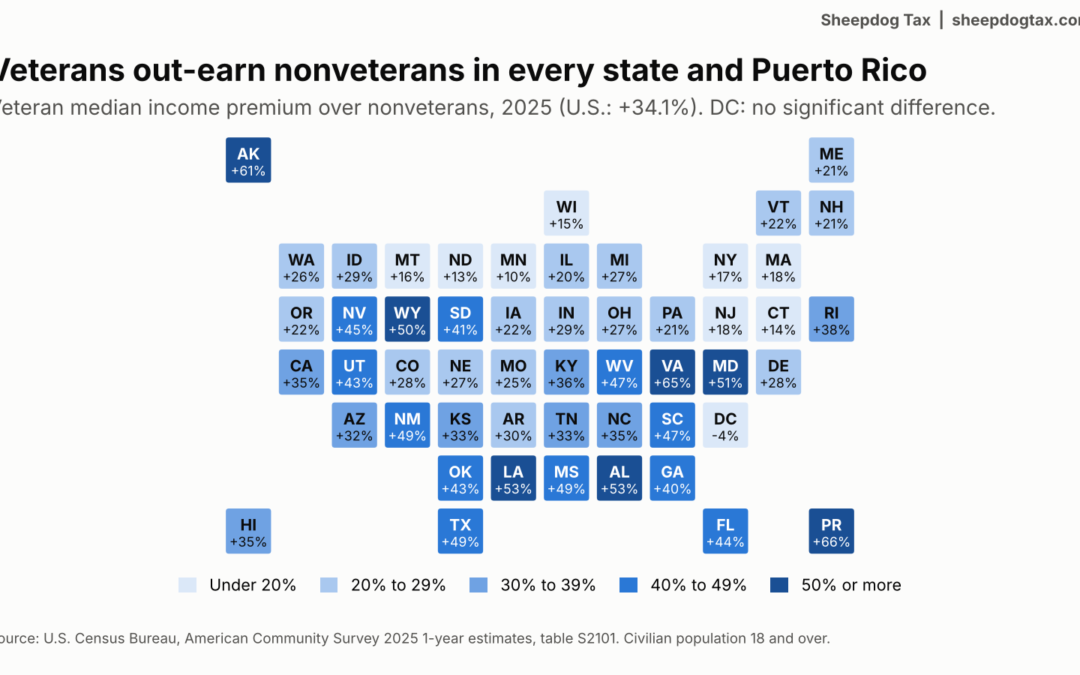
In 2025, veterans reported a higher median income than nonveterans in all 50 states and Puerto Rico, and every one of those differences is statistically significant. The District of Columbia is the exception: its veteran median is slightly lower, and the difference is well inside the margin of error. Nationally the figures were $57,483 against $42,878, a premium of 34%.
The premium runs from 10% in Minnesota to 65% in Virginia among the states, and reaches 66% in Puerto Rico. Texas sits at 49% ($61,453 against $41,276), 8th among the 50 states and DC. Veteran poverty is lower than nonveteran poverty in every area, and veteran unemployment is lower or statistically even everywhere except Montana.
Part 3 of this series showed four states using the 2024 release. This article uses the newer 2025 release and covers every area the data reaches.
Which states and territories are covered
The source is the Census Bureau’s American Community Survey (ACS) 2025 1-year estimates, table S2101, Veteran Status. The ACS covers the 50 states, DC and Puerto Rico, which makes 52 areas. It is not conducted in Guam, the U.S. Virgin Islands, the Northern Mariana Islands or American Samoa; those areas are measured once a decade through the Island Areas Censuses, so no comparable 2025 figures exist for them.
The premium, state by state
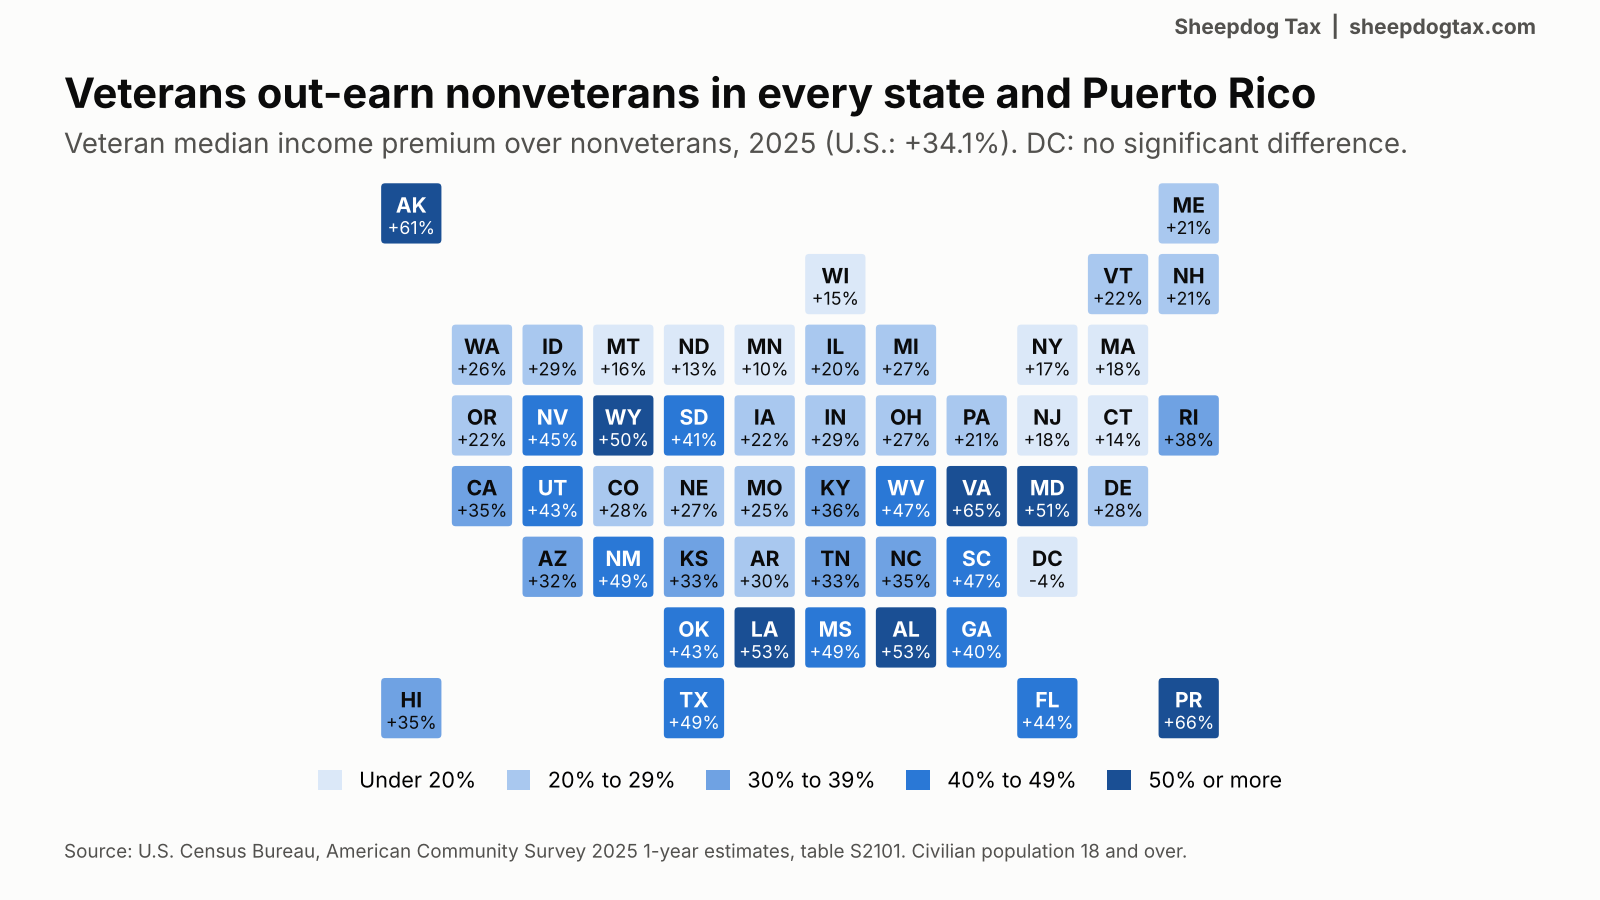
7 areas show a premium of 50% or more. Among the 50 states and DC, the five largest premiums are Virginia (65%), Alaska (61%), Louisiana (53%), Alabama (53%), Maryland (51%). The five smallest are District of Columbia (-4%), Minnesota (+10%), North Dakota (+13%), Connecticut (+14%), Wisconsin (+15%).
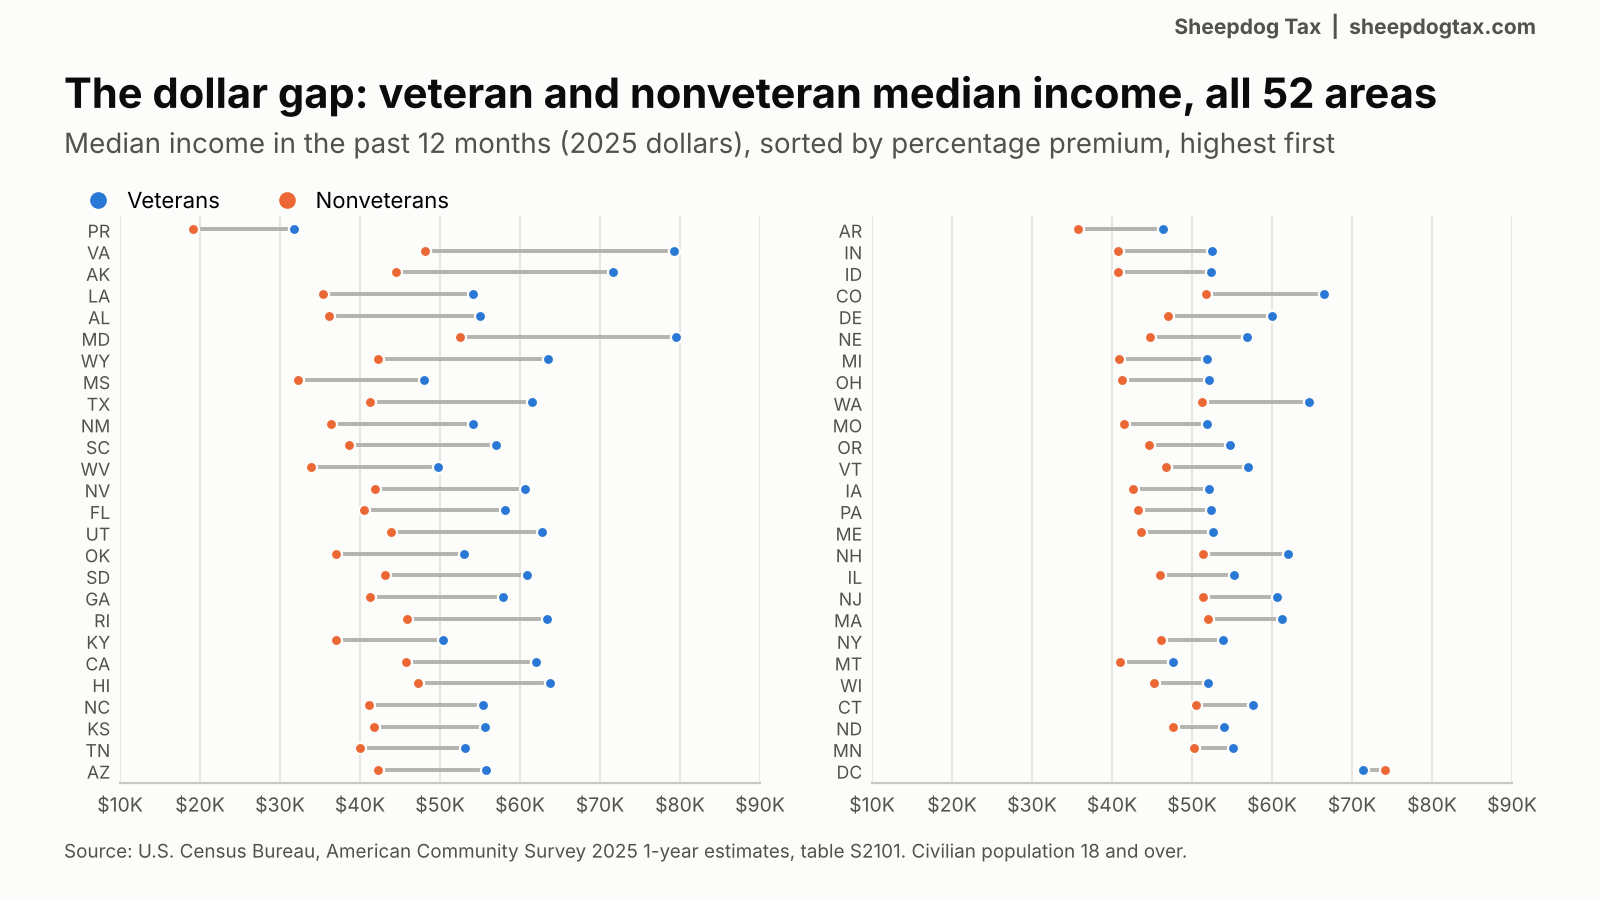
In dollars, the widest gaps are in Virginia ($31,109), Alaska ($27,110) and Maryland ($26,986). DC reports $71,416 for veterans against $74,164 for nonveterans, but its small veteran population produces a margin of error of $24,976, so the two cannot be told apart.
Why the premium varies
Age explains a large share of the spread. Veterans are older than nonveterans everywhere: nationally 49.7% of veterans are 65 or older against 22.5% of nonveterans. Where that age gap is narrower, the premium is larger. Across the 50 states and DC the correlation is -0.71.
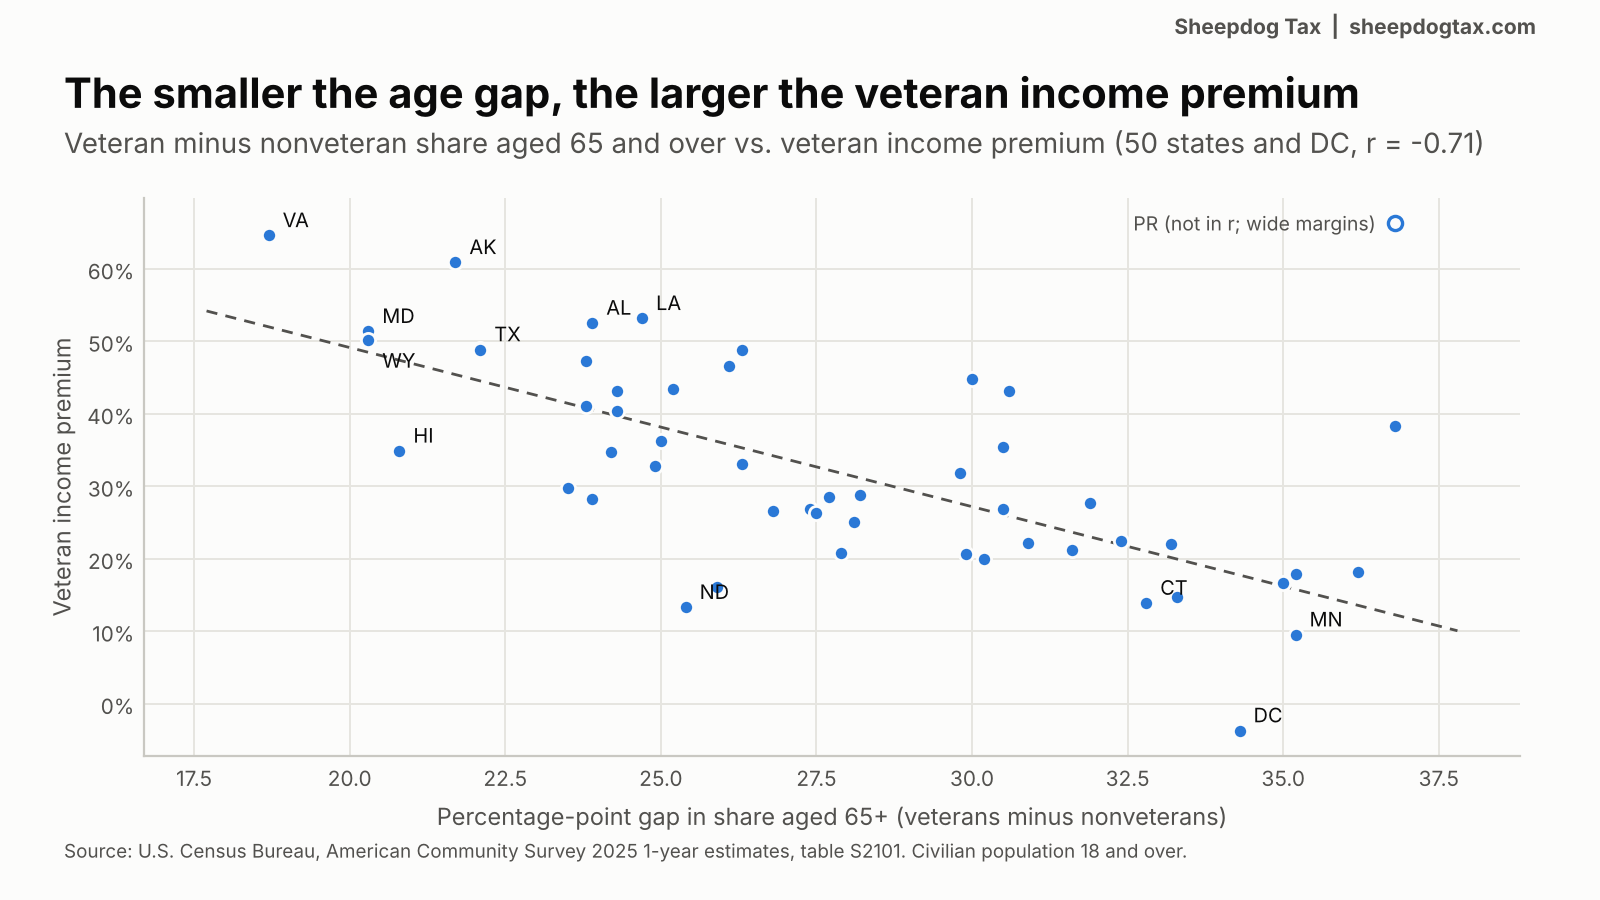
The premium is also larger where nonveteran incomes are lower (correlation -0.55), which is partly arithmetic: the same dollar gap is a bigger percentage on a smaller base. Correlation is not cause. The explanations below are my working hypotheses (opinion), each testable with data that exists.
- Working-age veterans. Where more veterans are under 65, more of them are drawing wages, often on top of military retirement pay or VA compensation, while a state’s older veterans are more likely to live on Social Security and savings.
- Installation and defense economies. Virginia, Maryland, Alaska, Alabama and Texas combine large military footprints with federal and contractor employers that recruit veterans at above-median pay.
- A low civilian wage base. Mississippi, West Virginia, Louisiana, Arkansas and Alabama have the lowest nonveteran medians among the states, which enlarges the percentage premium even when the dollar gap is ordinary.
- Composition. Veterans are mostly men, and S2101 does not cross income by sex within veteran status, so this table cannot separate a sex-composition effect from a veteran effect.
Poverty: lower for veterans in every area
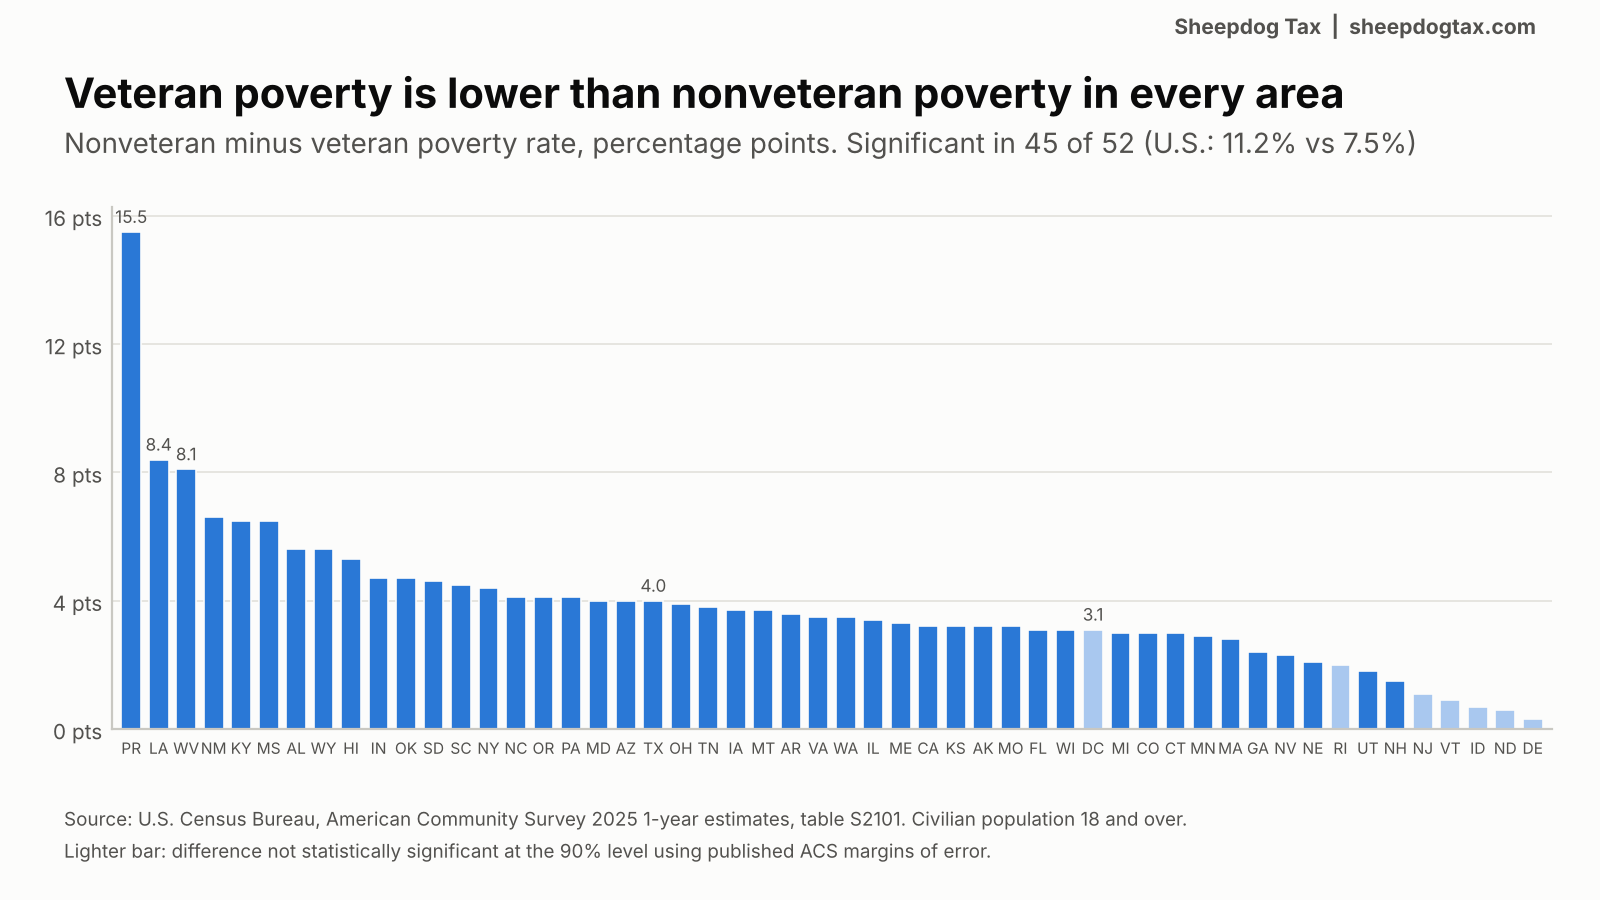
Nationally, 7.5% of veterans had income below the poverty level against 11.2% of nonveterans. The veteran rate is lower in all 52 areas, and the difference is statistically significant in 45. The seven where it is not: Delaware, District of Columbia, Idaho, New Jersey, North Dakota, Rhode Island, Vermont. Puerto Rico has the widest gap by far: 18.1% of veterans against 33.6% of nonveterans.
Unemployment: lower or statistically even, with one exception
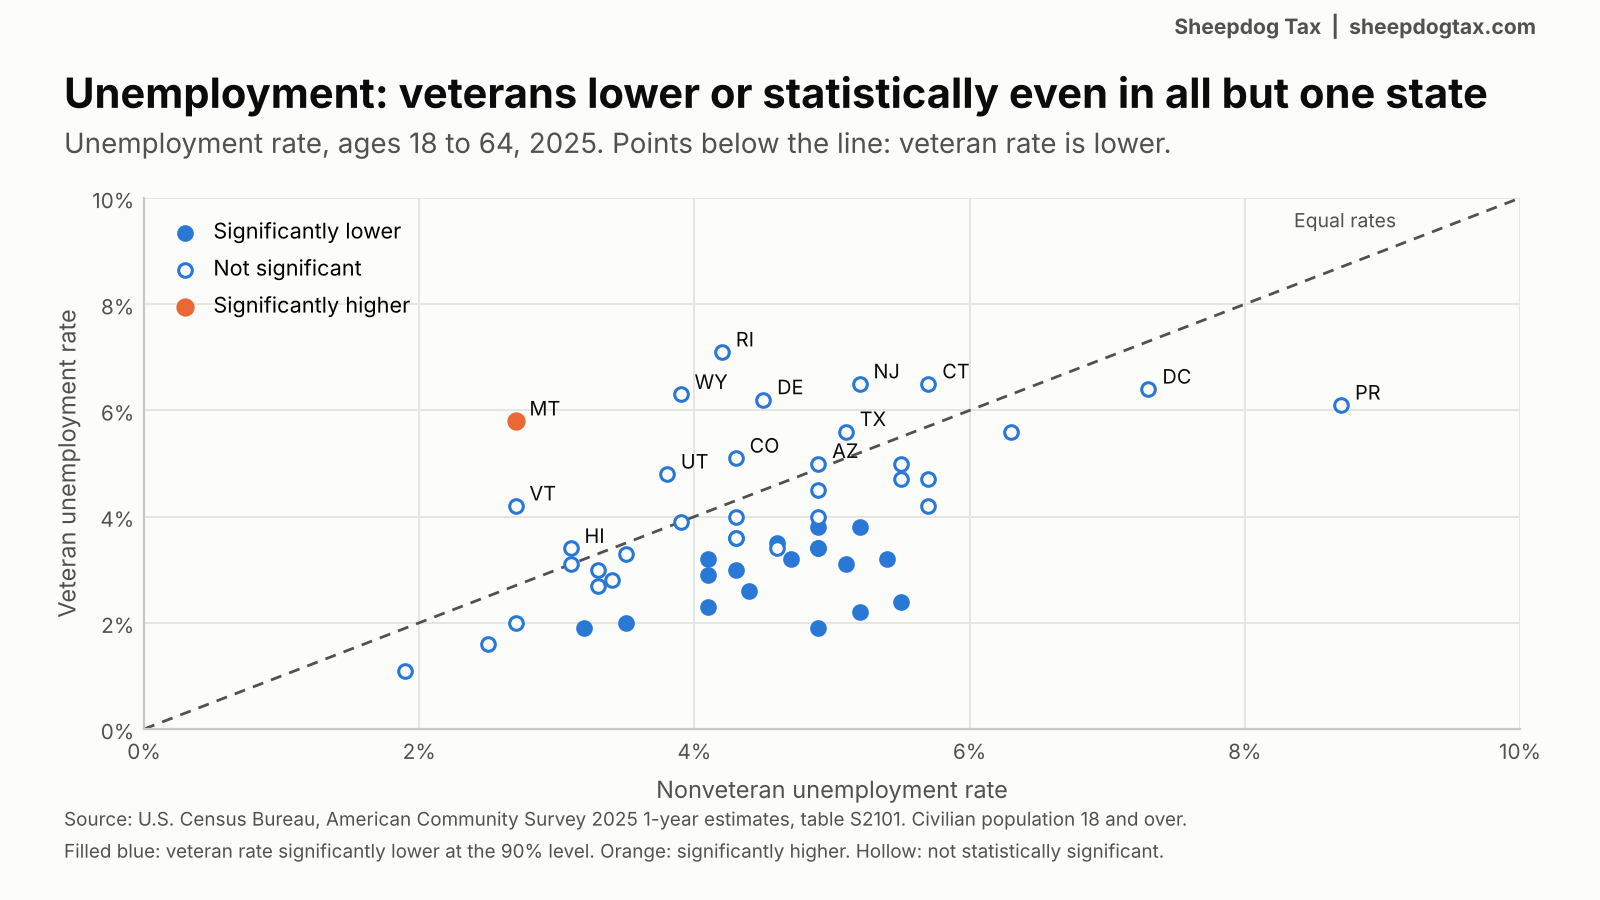
For ages 18 to 64, the national unemployment rate was 4.0% for veterans and 4.9% for nonveterans. At the state level, veteran labor forces are small and margins of error are wide. The veteran rate is significantly lower in 19 areas, significantly higher only in Montana (5.8% against 2.7%), and statistically even in the rest.
Texas shows a veteran rate of 5.6% against 5.1%, a difference that is not statistically significant. Nevada shows 4.2% against 5.7%, also not significant. The Census Bureau modified the ACS labor force questions for 2025, as its ACS program update notes, so I do not compare these unemployment rates with earlier years.
What this means for veterans and their advisers
Two features of this data matter for anyone using it in a financial or tax conversation.
- Income here is not wages. ACS income counts all sources, including military retirement pay and VA payments. Nationally 32.0% of veterans report a disability against 15.1% of nonveterans, so VA disability compensation is part of many veteran incomes. Under IRS Publication 525, VA disability benefits are not taxable, while military retirement pay based on age or length of service is. Two veterans with the same ACS income can have very different taxable income.
- A median is a midpoint, not a forecast. A state premium describes a population, not any one veteran. Separation year, disability rating, retirement eligibility, location and family income drive the individual result.
My view (opinion): the veteran premium is real and broad, but it is better read as a measure of household stability, with retirement pay and VA compensation doing much of the work, than as proof that the civilian job market pays veterans more for the same work. Parts 2 and 3 of this series are the better evidence on jobs and earnings.
The full table
Sorted by premium. Median income is for the civilian population 18 and over with income, in 2025 dollars. Poverty is for the population 18 and over for whom poverty status is determined; unemployment is for the civilian labor force aged 18 to 64.
| Rank | Area | Veterans | Veteran median income | Nonveteran median income | Premium | Veteran poverty | Nonveteran poverty | Veteran unemployment | Nonveteran unemployment |
|---|---|---|---|---|---|---|---|---|---|
| 1 | Puerto Rico | 62,071 | $31,741 | $19,087 | +66.3% | 18.1% | 33.6% | 6.1% | 8.7% |
| 2 | Virginia | 623,047 | $79,246 | $48,137 | +64.6% | 5.9% | 9.4% | 2.9% | 4.1% |
| 3 | Alaska | 53,052 | $71,616 | $44,506 | +60.9% | 6.9% | 10.1% | 2.2% | 5.2% |
| 4 | Louisiana | 215,419 | $54,186 | $35,373 | +53.2% | 8.1% | 16.5% | 3.4% | 4.6% |
| 5 | Alabama | 304,284 | $55,039 | $36,080 | +52.5% | 8.1% | 13.7% | 3.4% | 4.9% |
| 6 | Maryland | 321,975 | $79,490 | $52,504 | +51.4% | 5.3% | 9.3% | 1.9% | 4.9% |
| 7 | Wyoming | 37,969 | $63,471 | $42,254 | +50.2% | 5.1% | 10.7% | 6.3% | 3.9% |
| 8 | Mississippi | 151,386 | $47,992 | $32,226 | +48.9% | 10.2% | 16.7% | 3.2% | 5.4% |
| 9 | Texas | 1,446,930 | $61,453 | $41,276 | +48.9% | 7.7% | 11.7% | 5.6% | 5.1% |
| 10 | New Mexico | 130,350 | $54,183 | $36,395 | +48.9% | 8.6% | 15.2% | 4.0% | 4.9% |
| 11 | South Carolina | 350,835 | $56,961 | $38,679 | +47.3% | 8.1% | 12.6% | 3.2% | 4.7% |
| 12 | West Virginia | 107,341 | $49,768 | $33,931 | +46.7% | 7.8% | 15.9% | 4.5% | 4.9% |
| 13 | Nevada | 186,734 | $60,668 | $41,902 | +44.8% | 8.2% | 10.5% | 4.2% | 5.7% |
| 14 | Florida | 1,318,557 | $58,179 | $40,541 | +43.5% | 7.7% | 10.8% | 3.6% | 4.3% |
| 15 | Utah | 116,210 | $62,795 | $43,854 | +43.2% | 7.0% | 8.8% | 4.8% | 3.8% |
| 16 | Oklahoma | 237,887 | $52,985 | $37,005 | +43.2% | 8.9% | 13.6% | 2.6% | 4.4% |
| 17 | South Dakota | 55,558 | $60,871 | $43,159 | +41.0% | 6.6% | 11.2% | 1.6% | 2.5% |
| 18 | Georgia | 596,611 | $57,875 | $41,235 | +40.4% | 8.9% | 11.3% | 3.8% | 4.9% |
| 19 | Rhode Island | 42,095 | $63,416 | $45,840 | +38.3% | 7.2% | 9.2% | 7.1% | 4.2% |
| 20 | Kentucky | 234,003 | $50,363 | $36,949 | +36.3% | 8.8% | 15.3% | 3.4% | 4.9% |
| 21 | California | 1,254,746 | $61,979 | $45,783 | +35.4% | 7.7% | 10.9% | 5.6% | 6.3% |
| 22 | Hawaii | 85,223 | $63,694 | $47,218 | +34.9% | 4.3% | 9.6% | 3.4% | 3.1% |
| 23 | North Carolina | 646,491 | $55,338 | $41,068 | +34.7% | 7.3% | 11.4% | 4.0% | 4.3% |
| 24 | Kansas | 143,511 | $55,593 | $41,750 | +33.2% | 6.8% | 10.0% | 2.0% | 3.5% |
| 25 | Tennessee | 375,004 | $53,159 | $40,029 | +32.8% | 8.0% | 11.8% | 2.3% | 4.1% |
| 26 | Arizona | 449,601 | $55,753 | $42,264 | +31.9% | 7.5% | 11.5% | 5.0% | 4.9% |
| 27 | Arkansas | 178,260 | $46,435 | $35,791 | +29.7% | 10.3% | 13.9% | 3.6% | 4.3% |
| 28 | Indiana | 315,178 | $52,535 | $40,791 | +28.8% | 6.6% | 11.3% | 3.0% | 4.3% |
| 29 | Idaho | 115,297 | $52,404 | $40,769 | +28.5% | 8.7% | 9.4% | 2.7% | 3.3% |
| 30 | Colorado | 331,110 | $66,465 | $51,803 | +28.3% | 6.2% | 9.2% | 5.1% | 4.3% |
| 31 | Delaware | 58,649 | $59,945 | $46,958 | +27.7% | 8.7% | 9.0% | 6.2% | 4.5% |
| 32 | Nebraska | 96,241 | $56,877 | $44,808 | +26.9% | 7.7% | 9.8% | 1.9% | 3.2% |
| 33 | Michigan | 433,589 | $51,889 | $40,901 | +26.9% | 8.8% | 11.8% | 3.8% | 5.2% |
| 34 | Ohio | 561,908 | $52,179 | $41,198 | +26.7% | 7.7% | 11.6% | 3.2% | 4.1% |
| 35 | Washington | 434,198 | $64,684 | $51,197 | +26.3% | 6.5% | 10.0% | 5.0% | 5.5% |
| 36 | Missouri | 334,269 | $51,890 | $41,506 | +25.0% | 8.0% | 11.2% | 3.3% | 3.5% |
| 37 | Oregon | 222,002 | $54,692 | $44,679 | +22.4% | 7.5% | 11.6% | 2.4% | 5.5% |
| 38 | Vermont | 33,009 | $57,049 | $46,702 | +22.2% | 8.2% | 9.1% | 4.2% | 2.7% |
| 39 | Iowa | 151,216 | $52,072 | $42,676 | +22.0% | 7.3% | 11.0% | 2.8% | 3.4% |
| 40 | Pennsylvania | 588,783 | $52,427 | $43,266 | +21.2% | 6.6% | 10.7% | 3.5% | 4.6% |
| 41 | Maine | 89,159 | $52,683 | $43,631 | +20.7% | 6.7% | 10.0% | 3.0% | 3.3% |
| 42 | New Hampshire | 82,036 | $61,952 | $51,326 | +20.7% | 4.5% | 6.0% | 2.0% | 2.7% |
| 43 | Illinois | 450,893 | $55,218 | $46,003 | +20.0% | 7.5% | 10.9% | 4.7% | 5.5% |
| 44 | New Jersey | 254,840 | $60,652 | $51,324 | +18.2% | 7.2% | 8.3% | 6.5% | 5.2% |
| 45 | Massachusetts | 222,521 | $61,303 | $52,020 | +17.8% | 6.9% | 9.7% | 3.1% | 5.1% |
| 46 | New York | 524,170 | $53,854 | $46,139 | +16.7% | 8.5% | 12.9% | 4.7% | 5.7% |
| 47 | Montana | 78,530 | $47,586 | $40,986 | +16.1% | 7.5% | 11.2% | 5.8% | 2.7% |
| 48 | Wisconsin | 271,392 | $51,957 | $45,293 | +14.7% | 6.8% | 9.9% | 3.1% | 3.1% |
| 49 | Connecticut | 134,586 | $57,585 | $50,559 | +13.9% | 5.7% | 8.7% | 6.5% | 5.7% |
| 50 | North Dakota | 39,118 | $53,941 | $47,603 | +13.3% | 9.0% | 9.6% | 1.1% | 1.9% |
| 51 | Minnesota | 240,553 | $55,070 | $50,280 | +9.5% | 6.0% | 8.9% | 3.9% | 3.9% |
| 52 | District of Columbia | 19,902 | $71,416 | $74,164 | -3.7% | 11.0% | 14.1% | 6.4% | 7.3% |
| United States | 15,746,228 | $57,483 | $42,878 | +34.1% | 7.5% | 11.2% | 4.0% | 4.9% |
Method and limits
- All figures come from ACS 2025 1-year table S2101 for the civilian population 18 and over. The premium is the veteran median divided by the nonveteran median, minus one.
- Statistical significance uses the published 90% margins of error and the Census Bureau’s standard test for the difference between two estimates, the same method as its Statistical Testing Tool. A difference is significant when it exceeds the square root of the sum of the squared margins of error.
- The age-gap measure is the percentage of veterans aged 65 and over minus the percentage of nonveterans aged 65 and over. Correlations use the 50 states and DC; Puerto Rico is shown but excluded because its veteran estimates carry very wide margins of error.
- S2101 reports period of service, not branch, and does not separate wages from other income. Medians cannot be added or averaged across states.
- Part 3 of this series used the 2024 release; figures here differ because they are a newer survey year, not a correction.
- Puerto Rico data comes from the Puerto Rico Community Survey, which is part of the ACS. Guam, the U.S. Virgin Islands, the Northern Mariana Islands and American Samoa are not in the ACS.
Related reading
- Part 1: The Hazlewood Legacy bill Texas colleges paid
- Part 2: Where Texas veterans build jobs
- Part 3: What each branch earns in Texas
- All Texas Veterans research
For a scoped engagement inquiry, email Noah Green with a short description of the issue and any upcoming deadline. Do not send tax returns, identifying numbers or other sensitive records through ordinary email. Secure document instructions follow separately. Payment and your signature may initiate an engagement request; they do not mean the case has been accepted. I review the facts after payment and must countersign the engagement letter and accept the case before work begins. The accepted written engagement governs scope.
This article provides general information drawn from public data, not tax, legal or financial advice for your specific facts. No outcome is guaranteed.
Sources
- U.S. Census Bureau, American Community Survey 2025 1-year, S2101: veteran and nonveteran income, poverty, unemployment, age and disability for every state, DC and Puerto Rico
- U.S. Census Bureau, ACS Statistical Testing Tool: method for testing differences between ACS estimates at the 90% level
- U.S. Census Bureau, 2020 Island Areas Censuses FAQ: the ACS is not conducted in the Island Areas
- U.S. Census Bureau, ACS program updates (May 2026): labor force questions modified for the 2025 ACS
- IRS Publication 525, Taxable and Nontaxable Income: military retirement pay and VA benefits
Prepared by Noah Green, CPA, CFE, CTRS.